Portfolio
📊 Sales & Profit Dashboard (Power BI)
Problem
Managers needed insights into cost, profit, and revenue trends across years, regions, and product lines.
Dataset
- Mock data (~5,000+ rows) structured like a real sales system
- Columns: Order Date, Customer, Product, Cost, Profit, Revenue
⚠️ Note: Mock data used to protect client confidentiality
Approach
- Built DAX measures (Revenue, Profit Margin, YTD Growth)
- Used Power Query for cleaning and transformations
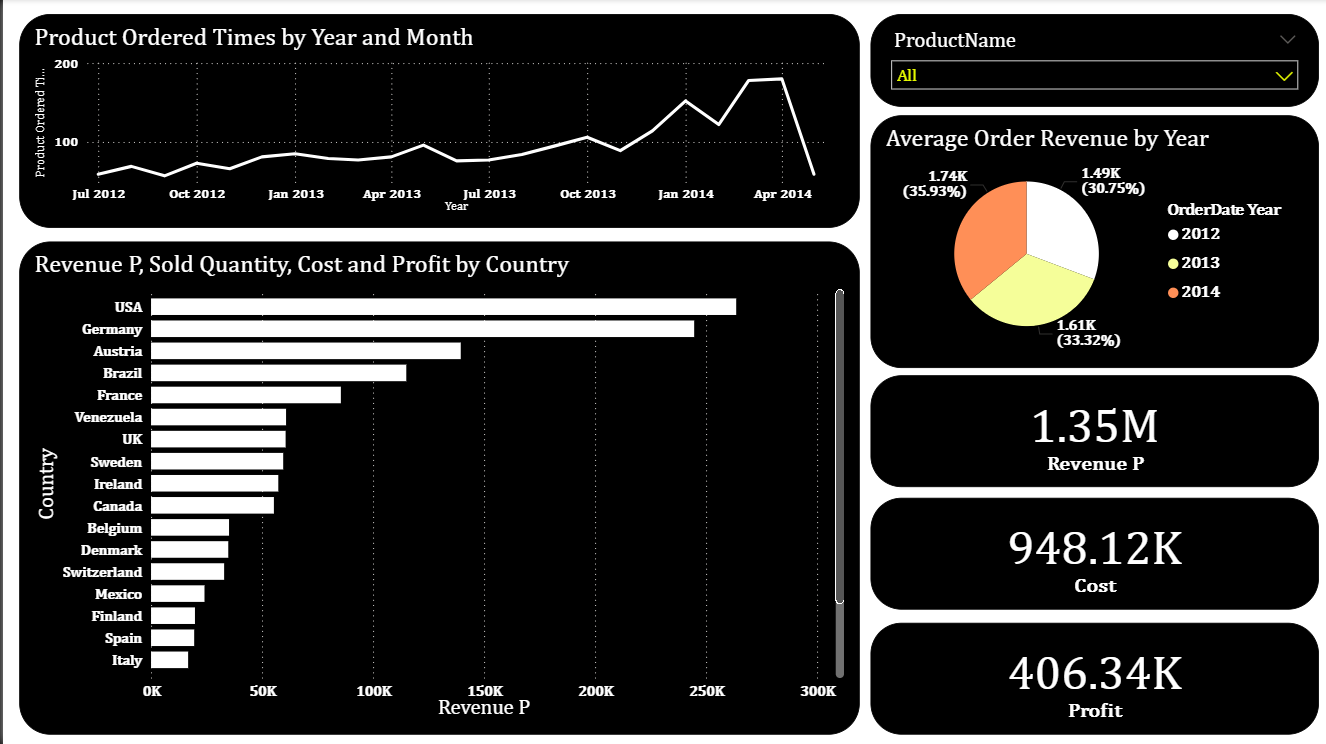
- Designed interactive visualizations:
- Revenue vs Profit by Year
- Sold Quantity by City
- Profit by Country & Product
Results
✅ Automated multi-level reporting
✅ Identified top-performing regions & products
✅ Reduced manual Excel reporting efforts
Preview