Portfolio
📊 Returns Analysis Dashboard (Power BI)
Problem
Business wanted to understand the financial impact of product returns on revenue, profit, and customer segments.
Dataset
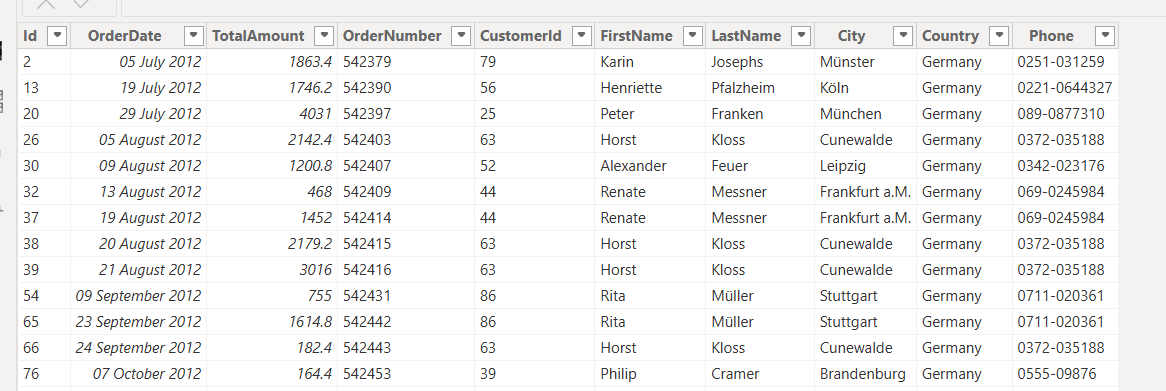
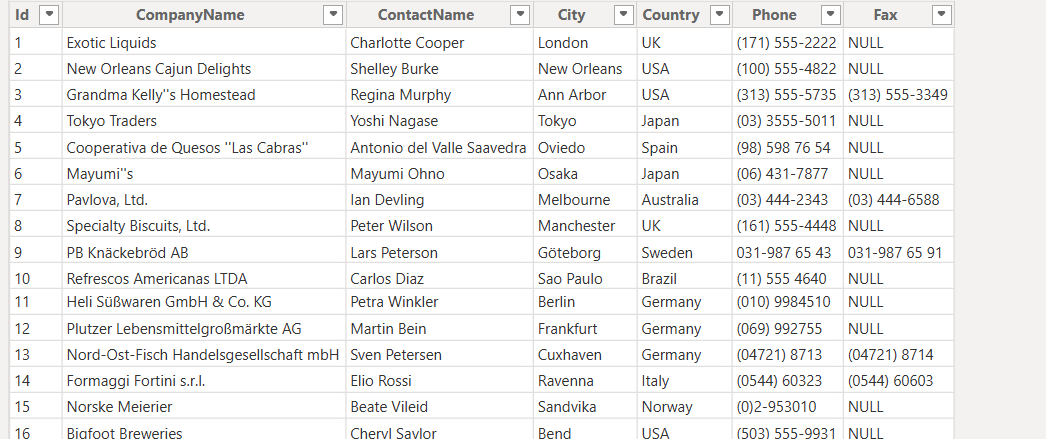
- Mock dataset (~10,000+ orders, 2009–2012)
- Fields: Order Date, Customer, Product, Sales, Returns, Refunds, Profit
⚠️ Note: Mock data used to protect client confidentiality
Approach
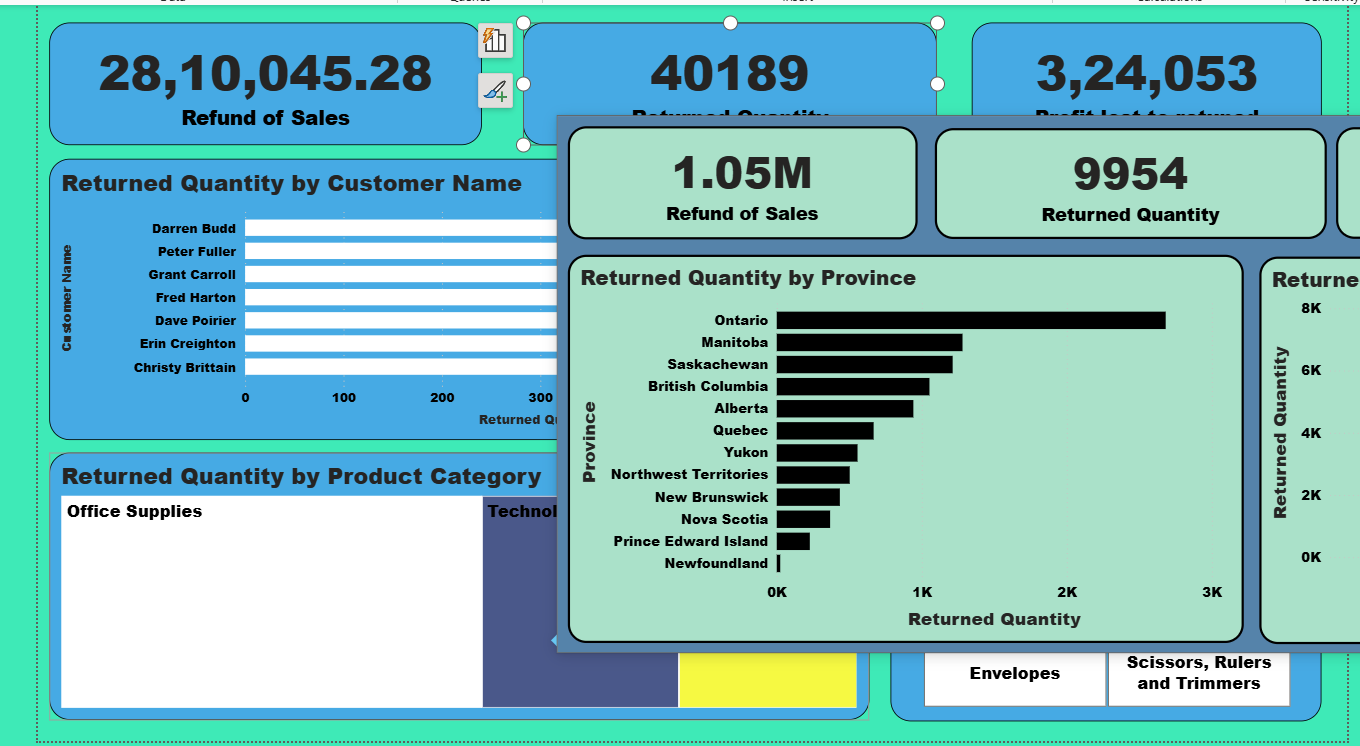
- Built KPIs: Refund of Sales, Returned Quantity, Profit Lost to Returns
- Created breakdowns by Region, Customer Segment, Product Category
- Used DAX measures for “Revenue after Returns” and “Profit after Returns”
- Added slicers for Shipping Mode, Province, Product Sub-Category
Results
✅ Identified $2.8M in refunded sales and $324K lost profit
✅ Highlighted regions and customer segments with highest returns
✅ Gave management visibility into return trends by category & mode
Preview